Graphing Activities for Kindergarten and First Grade
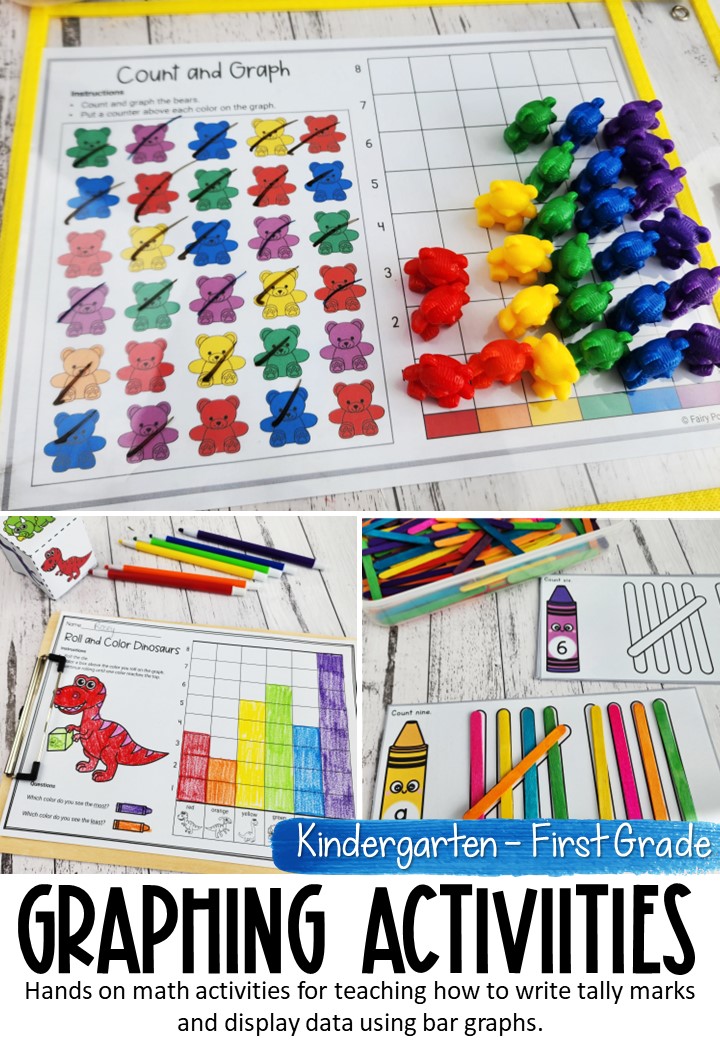
These hands on graphing activities help kids learn how to write tally marks and record data on a bar graph. They make a great addition to Kindergarten or First Grade math centers.
How To Teach Graphing
I find the best way to teach graphing to kids in Kindergarten or First Grade is to use hands-on manipulatives such as counting cubes and themed counters (counting bears, dinosaurs, fruits and so on). Here are a few tips to get you started:
- Begin with Sorting Counters: Start by grouping a set of sorting counters such as counting bears or dinosaurs. Teach the kids to sort these based on color or shape. This is a fun way to introduce them to the concept of categorizing, which is essential for graphing.
- Create Graphs Together: Use a large paper or board to make a basic graph. For example, if you’ve sorted fruit counters, draw columns for each fruit type and let the children add a sticker or mark for each fruit in the correct column. This helps them visually understand graphing.
- Count and Explore: After completing the graph, count the items in each category with the kids. Ask simple questions like “Which has the most?” or “Are there more apples or bananas?” This engages them in basic data analysis.
- Incorporate Stories or Themes: Use stories or interesting themes to make graphing more engaging. Create graphs about animals from a story or favorite fruits to eat.
- Practice with Different Examples: Keep practicing with various themed sorting counters. Some of my favorite themes for graphing include dinosaurs, fruits, counting bears and colored cubes.
Hands-on Graphing Activities
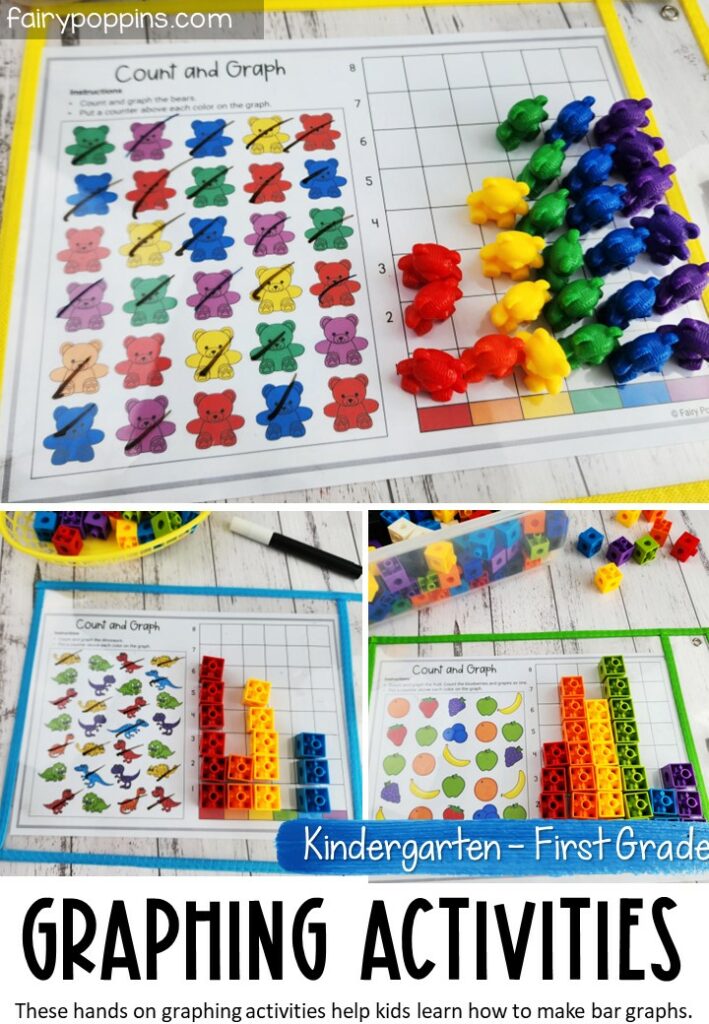
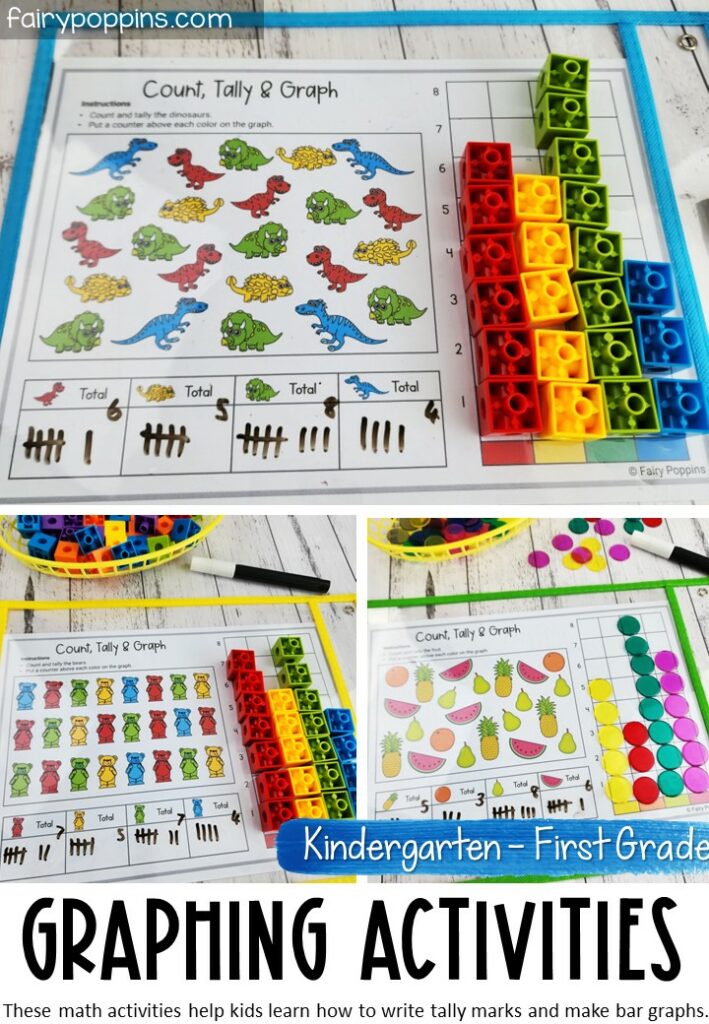
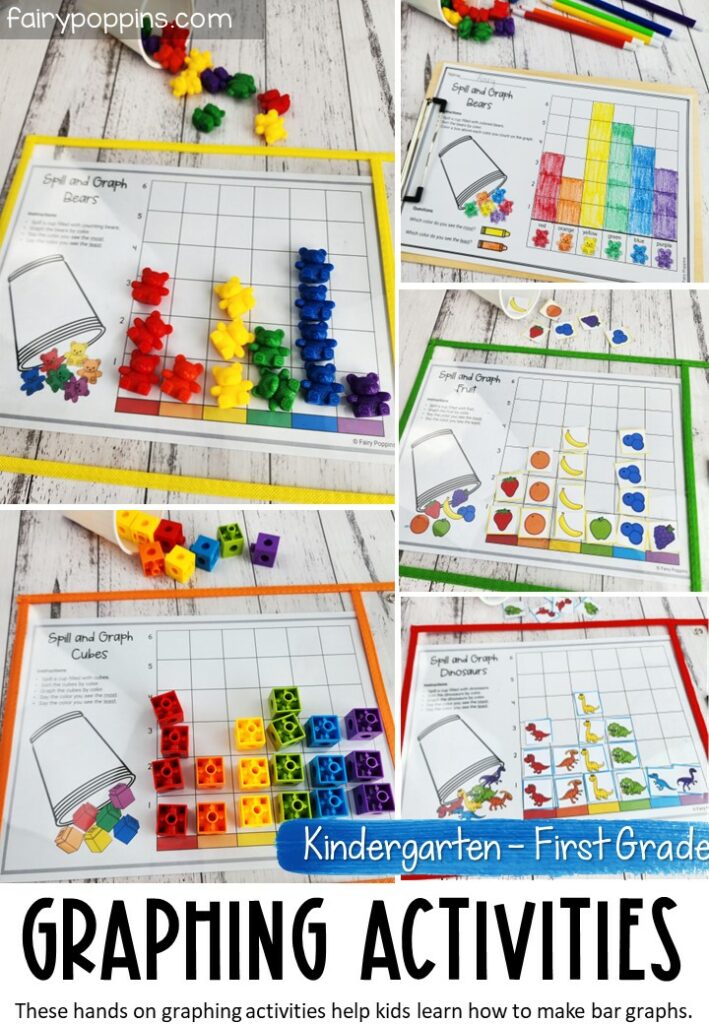
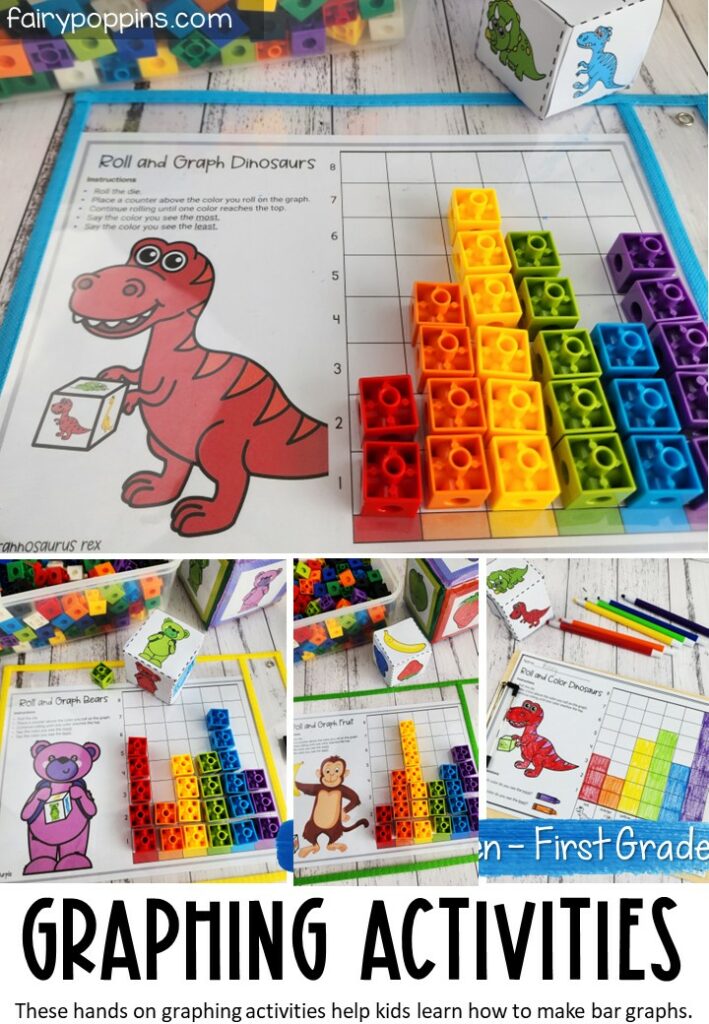
I created the following graphing activities to help kids learn how to display data using a bar graph. Most of the activities use readily available math manipulatives such as counting bears, cubes or dinosaurs. I’ve included printable counters in some of the activities too.
Tally Marks Activities
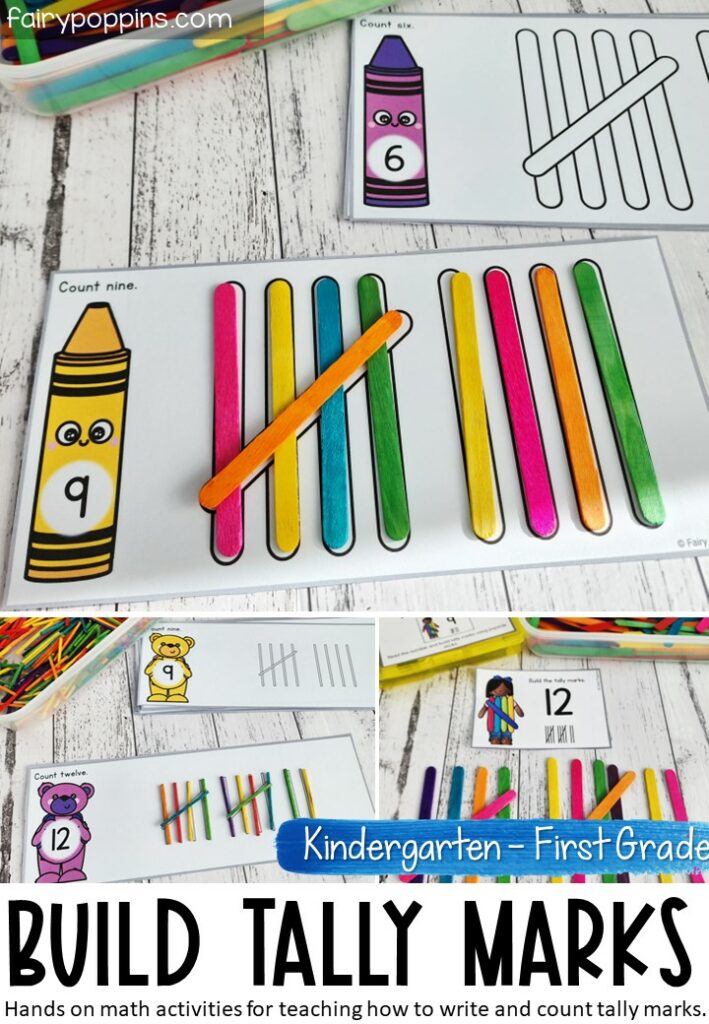
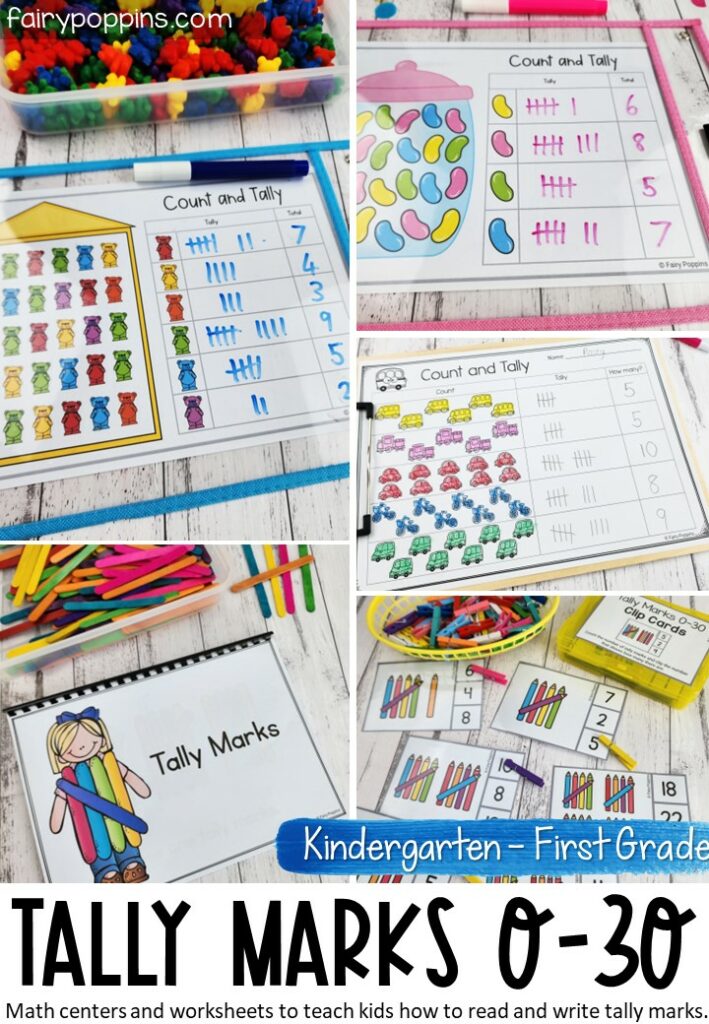
The following tally marks activities help kids learn how to write tally marks. This is a very useful skill to have when recording data to turn into a bar graph.
<< Find these building tally marks activities here >>
<< Get these counting tally marks activities here >>
Bar Graph Activities
<< Learn more about these count and graph activities here >>
<< Grab these count, tally and graph activities here >>
<< Grab these spill and graph activities here >>
<< Get the roll and graph activities here >>
More Fun Graphing Activities
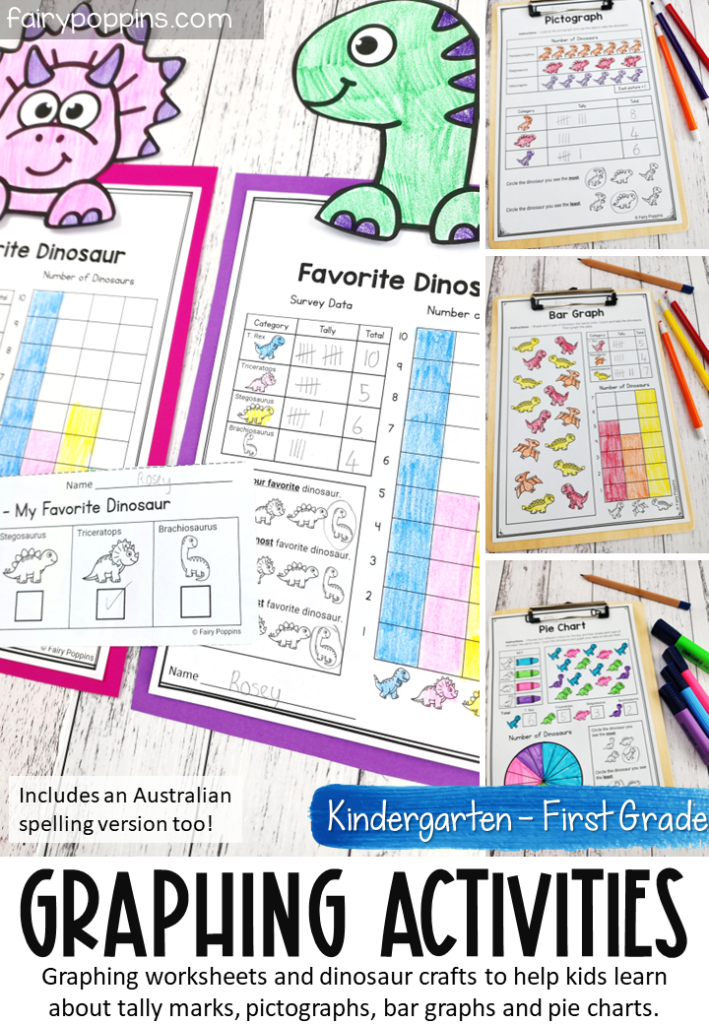
You may also love the following graphing worksheets which include a craft, bar graph, pie chart and picture graph activities. Learn more about these here.
<< Find these dinosaur graphing worksheets here >>
I hope you find these graphing activities useful for teaching kids how to collect data, write tally marks and make bar graphs. Happy teaching!

